# Debugging your DataGrid performance with custom tracks in Chrome DevTools
> Infinite Table will now add custom tracks to Chrome DevTools performance profiler to help you debug the performance of your DataGrid
Published: 2025-10-20
Author: radu
Tags: devtools, performance
Canonical page: https://infinite-table.com/blog/2025/10/20/debugging-your-datagrid-performance-with-custom-tracks-in-chrome-devtools-performance-profiler
> We want to make sure Infinite Table is the top React DataGrid in terms of performance. And we also want to give you the right tools to track down any slowness you might find in your app.
Infinite Table was the [first DataGrid with a DevTools extension](https://infinite-table.com/blog/2025/05/12/the-first-devtools-for-a-datagrid.md).
Today we announce Infinite Table is the first DataGrid that gives you custom tracks in Chrome DevTools performance profiles.
We've been inspired by the [React 19.2 release blogpost](https://react.dev/blog/2025/10/01/react-19-2#performance-tracks) where the React team announced the custom tracks being available in the performance profiler.
So we thought, why not!
To see your Infinite DataGrid instance in the Chrome DevTools profiler, make sure you specify the [`debugId`](https://infinite-table.com/docs/reference/infinite-table-props.md#debugId) prop.
Basically, if you have multiple grids in your app, you'll be able to see a dedicated track for each separate instance.
```tsx {3} title="Specify the debugId prop to see the DataGrid in the Chrome Profiler"
```
Once your [`debugId`](https://infinite-table.com/docs/reference/infinite-table-props.md#debugId) prop is configured, you can hit the recording the performance profile in Chrome DevTools, and once the profile is done, you'll see something similar to the image below.
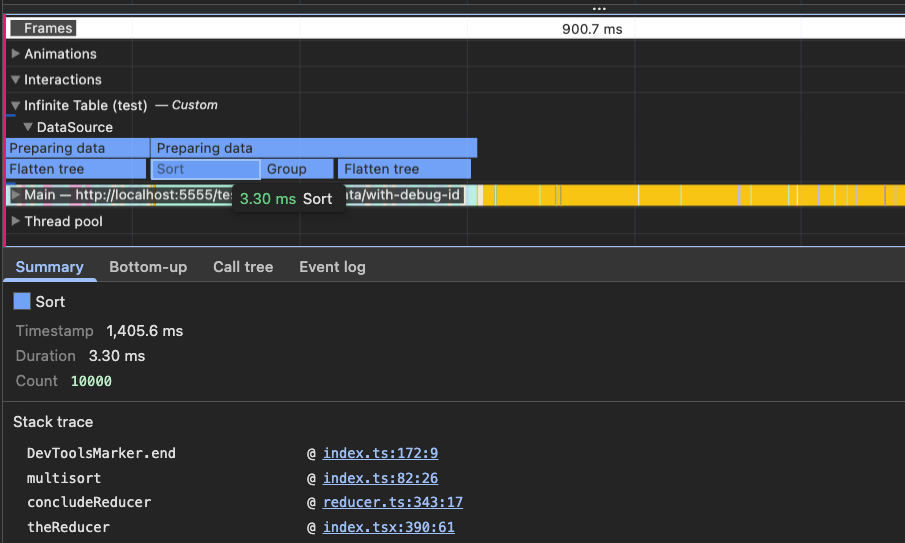
For now, we mainly show data-heavy operations, like sorting, grouping/filtering and flattening the data array, but more will be added in the near future.
```tsx
import {
InfiniteTable,
DataSource,
DataSourceData,
type InfiniteTableColumn,
type InfiniteTablePropColumns,
} from '@infinite-table/infinite-react';
import * as React from 'react';
type Developer = {
id: number;
firstName: string;
lastName: string;
country: string;
city: string;
currency: string;
preferredLanguage: string;
stack: string;
canDesign: 'yes' | 'no';
hobby: string;
salary: number;
age: number;
};
const dataSource: DataSourceData = () => {
return fetch(process.env.NEXT_PUBLIC_BASE_URL + `/developers10k-sql?`)
.then((r) => r.json())
.then((data: Developer[]) => data);
};
const columns: InfiniteTablePropColumns = {
firstName: { field: 'firstName' },
country: { field: 'country' },
salary: {
field: 'salary',
type: 'number',
},
age: { field: 'age' },
id: { field: 'id' },
canDesign: { field: 'canDesign' },
preferredLanguage: { field: 'preferredLanguage' },
stack: { field: 'stack' },
hobby: { field: 'hobby' },
city: { field: 'city' },
currency: { field: 'currency' },
};
const shouldReloadData = {
sortInfo: false,
groupBy: false,
};
const groupColumn: InfiniteTableColumn = {
defaultWidth: 200,
};
export default function App() {
return (
<>
primaryKey="id"
data={dataSource}
defaultSortInfo={[
{ field: 'country', dir: -1 },
{ field: 'salary', dir: 1 },
]}
defaultGroupBy={[{ field: 'country' }, { field: 'preferredLanguage' }]}
shouldReloadData={shouldReloadData}
>
groupColumn={groupColumn}
groupRenderStrategy="single-column"
debugId="infinite-table-example"
columns={columns}
columnDefaultWidth={120}
/>
);
}
```
The custom tracks give you high-fidelity information about the time the operation took, but give you additional insights - like the count of your data-array for sorting operations, what types of manipulations actually take place with the data and more.
We're really interested to see what other insights you find useful and want us to include in the custom tracks. Reach out to us on [X](https://x.com/get_infinite) and let's start the conversation!